Real Estate Markets by State – States with the Most Housing Growth
In the United States, the housing market is in a near-constant state of evolution. This is because the conditions of the market are dependent on a number of variable factors, including interest rates, consumer confidence, the state of the economy and politics, and more. One important indicator of real estate market conditions is the availability of housing units, or housing supply.
Dependent on the availability of housing units in the United States, the country may experience a housing surplus or shortage, which can drive the market in either direction. In April 2021, Business Insider reported that record levels of Millennial homeownership are causing the United States to run out of houses.
With an almost certain housing shortage on the horizon, DeedClaim wanted to take a look at the history of housing growth across the country, keeping in mind that there are always ebbs and flows to these things. We looked at Census data from the last three decades to determine how many housing units were present in each state in each of those years, as well as when homes were built and occupied by their current residents. This produced some interesting insights, which we thought were fitting to share.
Where has housing grown the most since 1990? Read on for that information, and so much more!
Results
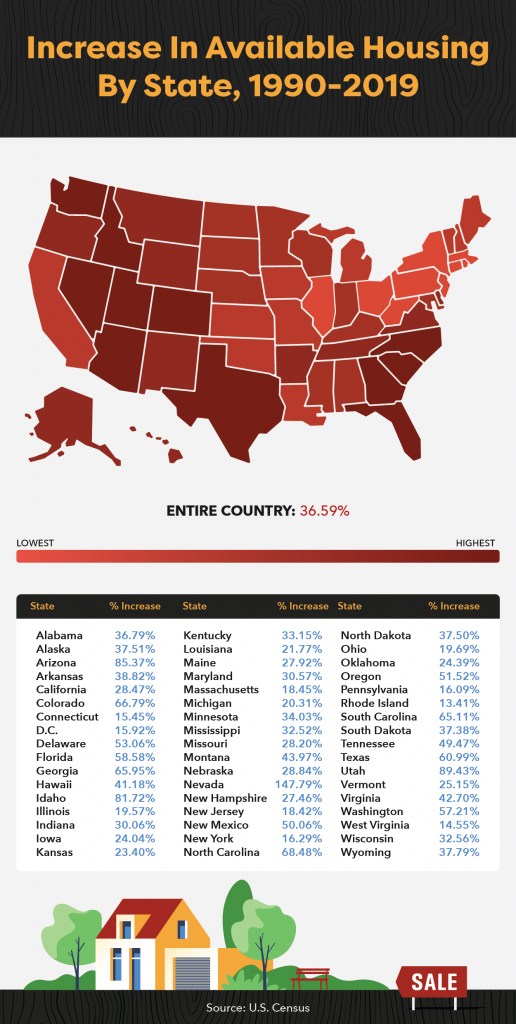
Overall, the United States has seen a nearly 37% increase in available housing units since 1990. As our nation grows in population, in general, available housing has been able to keep up. But where have these growth spurts been the most concentrated?
Since 1990, the greatest housing growth has occurred in the many Southwestern states, including Nevada (147.79%), Utah (89.43%), and Arizona (85.37%). Especially when comparing these growth numbers to the national average, it’s clear that the housing market in these states has been exploding during the last three decades.
Housing growth has been the slowest in the nation’s smallest states like Rhode Island (13.41%) and West Virginia (14.55%). But interestingly, these numbers aren’t too far off from densely populated Northeastern states like New York and New Jersey, where housing has only grown 16.29% and 18.42%, respectively. The available housing units in these states have undoubtedly fallen short of keeping up with their population growth.
Let’s shorten our time window and take a look at the trends over the last decade.
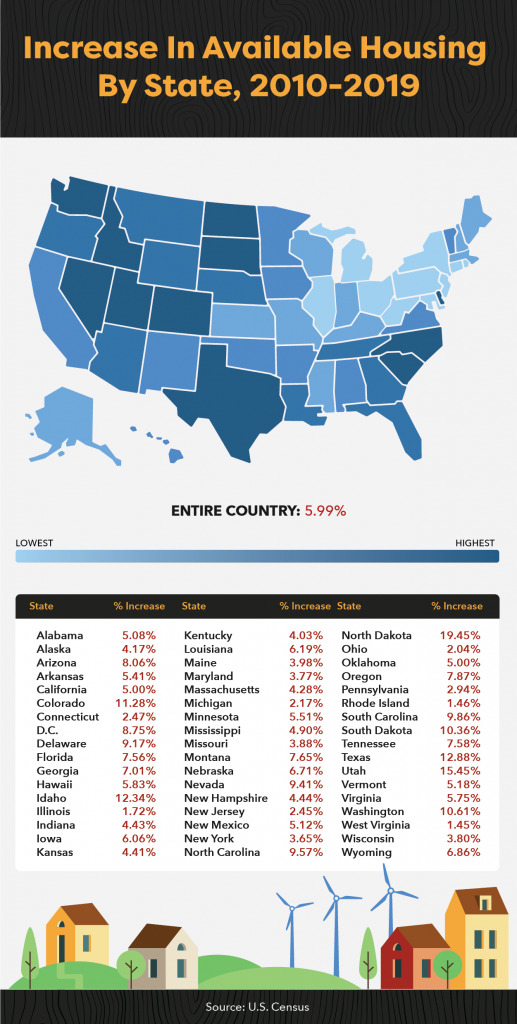
As you can see, the housing supply has only grown 6% since 2010. This is certainly in part due to the 2008 market crash that stagnated the economy and heavily affected the real estate market. Even still, the lack of housing growth was concentrated in some areas of the country more than others. The Northeastern cluster of states saw the least housing growth over the last decade, whereas we saw double-digit housing growth in states out West like Texas, Idaho, and Colorado.
Now, let’s zero in on how the most recent snapshot of the housing market looks, according to the most current data available from 2019.
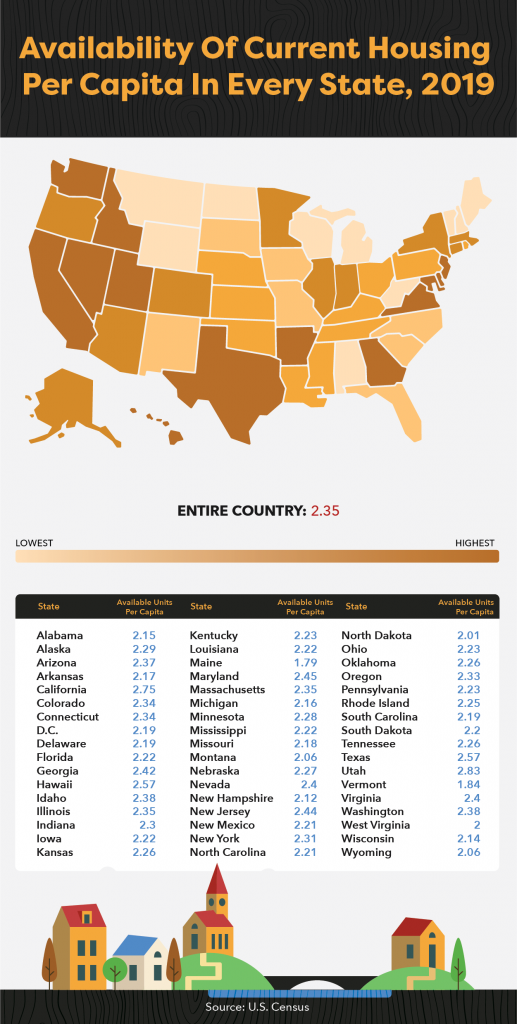
For this map, we analyzed the states with the most available housing based on population. We divided the number of housing units available in 2019 by the state’s population in order to determine the states with the most available housing per capita.
By this metric, we can see that the states where it’s easiest to find housing include Utah (2.83 units per capita), California (2.75), Hawaii (2.57), and Texas (2.57). Overall, in the United States, there are approximately 2.35 housing units available per capita.
Finally, we wanted to call out some interesting statistics when looking at trends in housing growth over the last decade.
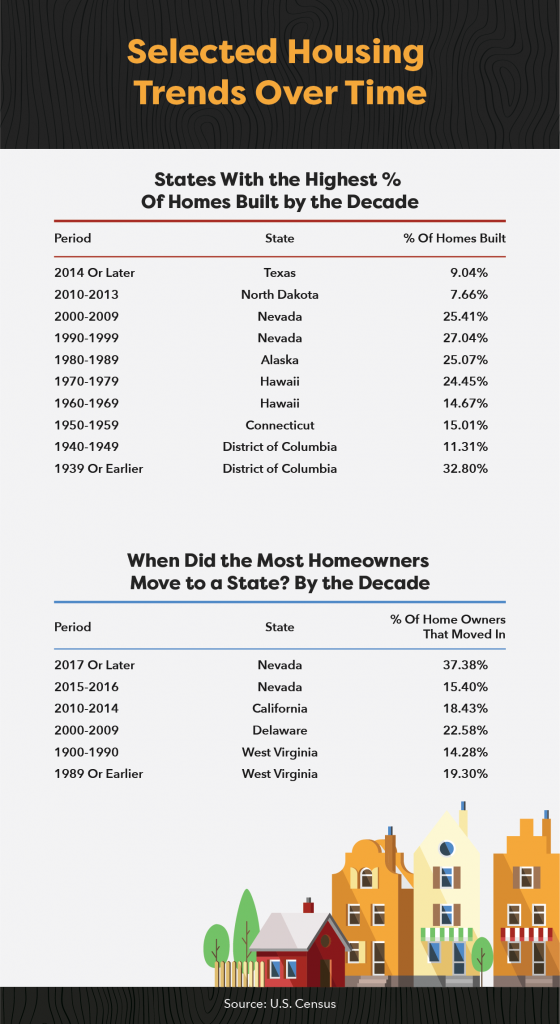
The first part of the above chart displays which state had the most explosive growth in housing when broken down by specific decades. Since 2014, Texas has been leading the charge, with nearly 9% of homes in Texas being built since then. Take a look at the data in order to determine which states have seen the most growth by period.
Ever wondered when there was a mass movement of new homeowners into your state? The bottom half of the above chart shows just that. Specifically, a whopping 37.38% of homeowners in Nevada have moved in since only 2017. That’s a short turnaround for such expansive growth.
Additional Data
That concludes our study findings from our deep dive into housing growth in the United States over the last three decades.
Interested in the above statistics on a state by state level? The full dataset on the percentage of homes built by decade, as well as the percentage of homeowners moving to a state, can be found in the interactive tables below. Search for your state or click on the column header to sort by category!

Methodology
Using data pulled from the U.S. Census covering 1990, 2000, 2010, and 2019, we determined how many housing units were present in each state in each of those years, as well as when current homes were built and occupied by their current residents. We then calculated percent change over time in every state, as well as what percentage of homes were built and when current residents moved in by different time periods.